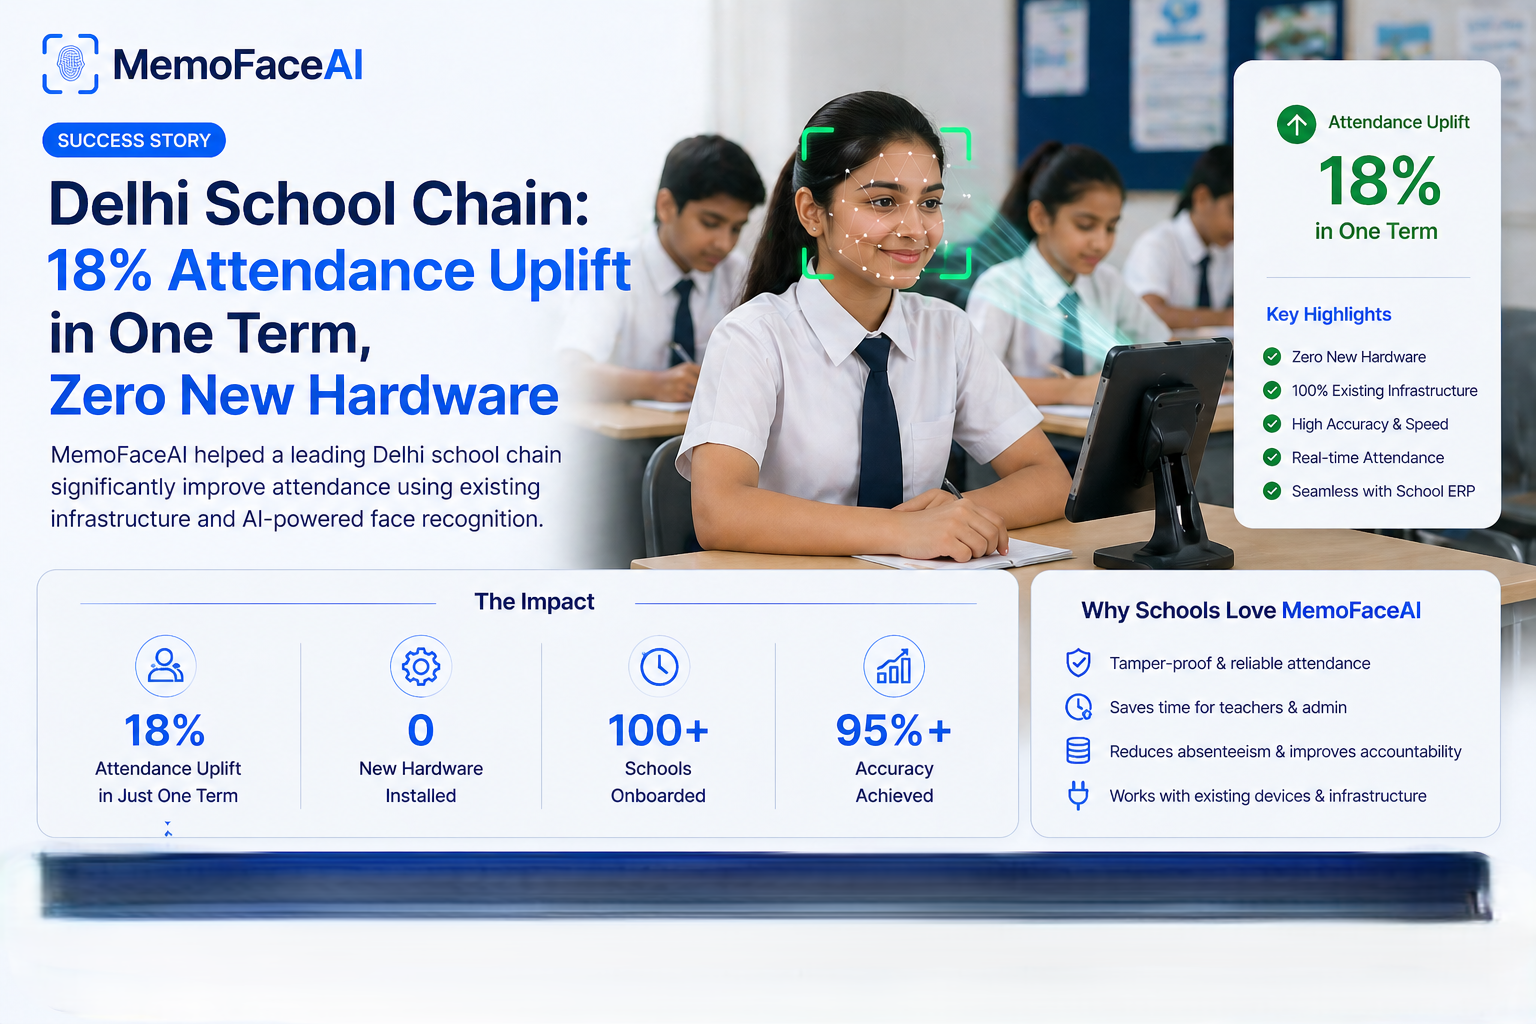
Sunrise Academy is a 6-school chain in Delhi NCR serving approximately 4,200 students across CBSE curriculum schools in Rohini, Dwarka, Noida, and Greater Noida. Before the intervention described in this case study, their average school-wide student attendance rate was 81.3%. By the end of one term, it was 96.1%. This is how that happened.
The Starting Point: What Was Being Done Before
An Academy had existing biometric fingerprint scanners for teacher attendance. Student attendance was taken manually by class teachers in paper registers, transferred to Excel by admin staff, and compiled into monthly reports by the principal's office. The process was accurate — when it worked. But it had three structural problems: a 5–7 day lag between an absence occurring and it appearing in any report, no parent notification for individual absences (only a monthly summary letter home), and no cross-school visibility for the chain management team.
The Intervention: Three Changes Made in Week 1
Change 1: MemoFaceAI software deployed as a student attendance management layer over the existing infrastructure — no new hardware. Teachers used the MemoFaceAI app on existing school tablets to mark attendance digitally at the start of each class. Took 4 minutes per class, down from 7–8 minutes for paper register.
Change 2: Automatic WhatsApp parent alerts activated for all absences, sent within 30 minutes of the class registration period. Parents received a message within half an hour of their child's absence — compared to the previous monthly letter. Response rate in week 1: 68%. By week 6: 81%.
Change 3: Weekly attendance dashboards shared with class teachers showing their class attendance rate, the school average, and a flag for students with three or more absences in the previous 30 days. Teachers who had never seen their class attendance data before now reviewed it every Monday morning.
The Progression: Term Week by Week
| Period | Average Attendance Rate | Change |
|---|---|---|
| Baseline (pre-deployment) | 81.3% | — |
| Week 2 | 84.7% | +3.4% |
| Week 4 | 88.2% | +6.9% |
| Week 8 | 93.4% | +12.1% |
| End of Term | 96.1% | +14.8% |
What Drove the Improvement
Post-term analysis pointed to three primary drivers. Parent awareness and response was the largest single factor — 44% of the attendance gain came from students who had previously had absences go unnoticed by parents until the monthly letter. The speed of notification was critical: same-day notification dramatically increased parent response rates versus the previous monthly summary. Teacher visibility was the second factor — teachers who could see their class attendance data took significantly more initiative in follow-up conversations with frequently absent students. The third factor was chain-level accountability — the management team could now compare attendance rates across all six schools in real time, which created constructive internal competition and peer learning.
Still Have Questions
Here are answers to the most common queries about AI-based attendance systems, biometric alternatives, workforce tracking, facial recognition attendance, and CCTV attendance monitoring.
FAQ
How did the school improve attendance by 18%?
By using AI-based attendance tracking that captures real student entry and exit without manual intervention.
Did the school install new hardware?
No. The system worked using existing CCTV infrastructure.
Can AI attendance improve school discipline?
Yes. It provides real-time visibility and prevents proxy attendance.
Is this suitable for large school chains?
Yes. It supports multiple campuses with centralized monitoring.
How quickly can such a system be deployed?
Deployment can be completed within a few days.